 , can be directly related to
the break flow rate as
 4. Evaluation of the APEX Break Flow Measurement System During Subcooled Depressurization
The current analysis compares the initial break flow rates measured by the BAMS with those estimated by the initial liquid level depression rate of the pressurizer using data from several OSU APEX Matrix tests. In addition to these data analyses, initial break flow rates are estimated using several well-known critical flow models: HEM, ERM, RLM, HFSM and OEM.
4.1 BAMS Assessment Methodology
Several small break simulations have been performed in the OSU APEX test facility. The
tests are initiated from subcooled conditions. That is, the hot leg temperature is usually
215 °C (420 °F) while the system pressure is maintained near 2700 kPa (390 psia). Upon
opening the break valve, the system undergoes a brief period of depressurization while at
subcooled conditions. For the one-inch break simulation, this corresponds to approximately
200 seconds, and for the one-half inch break simulation, this corresponds to approximately
800 seconds. During this period, subcooled critical flow is established at the break, and
the break flow is measured by the BAMS. Because there are no other mass losses from the
primary system, by using a simple mass balance, the change in liquid level in the
pressurizer,  , can be directly related to
the break flow rate as
|
(4-1) |
Figure 4-1 shows the pressurizer liquid level as a function of time for test NRC-5001 ![]() . The slope,
. The slope,  , of the pressurizer liquid level with respect to time (Figure 4-1) is
determined to be -5.62•10-3 m/s. Substituting the values for the slope,
the break cross-sectional flow area, the pressurizer liquid density and the pressurizer
cross-sectional flow area into Equation 4-1 yields an estimate of 25884 kg/m2s
for the critical flow rate at the break. Table 4-1 presents similar comparisons for
several of the small break simulations. The uncertainties associated with the pressurizer
liquid level measurements are discussed in Section 4.4.
|
Figure 4-1. NRC-5001 |
Figure 4-2. NRC-5005 |
|
Figure 4-3. NRC-5105 |
|
Figure 4-4. NRC-5007 |
|
Figure 4-5. NRC-5107 |
|
Figure 4-6. NRC-5010 |
In addition to comparing the measured flow rates to the pressurizer level data, it is also insightful to determine which critical flow correlations best describe the measured data. It should be noted that the break nozzles implemented in the test were designed to simulate the ratio of the actual AP600 pipe wall thickness to the break hole diameter (L/D). As such, the usual assumption of homogeneous equilibrium conditions (i.e., L/D ³ 40) would not be applicable. Table 4-2 lists the initial mass flux predictions of several well-known critical flow correlations.
4.2 Results of BAMS Assessment
The assessment of the BAMS included a quantification of the observed measurement delay. This time delay is discussed in greater detail in Section 0. As discussed in Section 4.1, a comparison of the BAMS initial flow rate measurements to calculations using Equation 4-1 is also summarized. The initial mass flux predictions of the critical flow models described in Chapter 1 are listed for comparison to the BAMS initial mass flux data. The results of the BAMS assessment are given in Table 4-1 and Table 4-2 below.
Table 4-1. Test data results from pressurizer level and BAMS break flow measurements.
Test ID |
|
BAMS Time Delay (seconds) |
BAMS Initial Mass Flux Data (kg/m2s) |
Pressurizer
(m/s) |
Mass Flux Using Equation 4-1 (kg/m2s) |
5539.3 |
68 |
28865 |
-5.62•10-3 |
25884 |
|
1384.8 |
77 |
31392 |
– |
– |
|
50735.4 |
134 |
27500 |
-7.16•10-4 |
30196 |
|
50735.4 |
28 |
28003 |
-6.10•10-4 |
25699 |
|
12612.4 |
153 |
34887 |
-2.96•10-3 |
31016 |
|
12612.4 |
99 |
30809 |
-2.48•10-3 |
25983 |
|
12612.4 |
115 |
31176 |
-2.49•10-3 |
26115 |
|
1384.8 |
73 |
31992 |
– |
– |
|
1384.8 |
80 |
27105 |
– |
– |
Table 4-2. Several critical flow correlations’ results for comparison with test data results shown in Table 4-1 (kg/m2s).
Test ID |
HEM |
OEM |
ERM |
RLM |
HFSM Using To and Po |
HFSM Using Tsat and Po |
NRC-5001 |
1366 |
42637 |
1273 |
3150 |
36669 |
30083 |
NRC-5003 |
1738 |
41559 |
1619 |
4003 |
34470 |
29623 |
NRC-5005 |
1276 |
42861 |
1192 |
2950 |
36431 |
30184 |
NRC-5105 |
1265 |
42862 |
1179 |
2918 |
36801 |
30167 |
NRC-5007 |
1265 |
42862 |
1179 |
2918 |
36709 |
30193 |
NRC-5107 |
1459 |
42685 |
1362 |
3369 |
37007 |
30220 |
NRC-5010 |
1548 |
42487 |
1445 |
3573 |
36673 |
30154 |
NRC-5111 |
1800 |
41451 |
1674 |
4139 |
34453 |
29609 |
NRC-5012 |
1191 |
42572 |
1109 |
2745 |
35010 |
29740 |
Several conclusions can be drawn from Table 4-1 and Table 4-2.
First, for the same set of initial conditions, the BAMS initial mass flux measurements are
consistent, within 7.9 percent, for all the tests listed in Table 4-1. That is, the
initial critical break mass flux measured by the BAMS was 30192 ±
2390 kg/m2s for similar initial conditions. The standard deviation,
2390 kg/m2s, corresponds to 7.9 percent of the mean measured mass flux.
Second, the BAMS measurements are in good agreement with the estimates provided by
Equation 4-1. The pressurizer initial break mass flux approximations made by Equation 4-1
yielded a prediction of 27482 ± 2225 kg/m2s,
which under-predicts the BAMS mean mass flux by 9.0 percent and demonstrates the
pressurizer liquid level measurements to be repeatable within 8.1 percent. Last,
comparisons of the BAMS measurements to the critical flow models indicate that the
Henry-Fauske Subcooled Model ![]() provides good agreement with the measured data when
one uses a saturated temperature, Tsat, at the given system pressure, Po.
Since the HFSM was developed for saturated and subcooled liquid system conditions, this is
a valid assumption (see Section 2.3). The HFSM over-predicts the BAMS mean mass flux by
19.3 percent when a subcooled pressure and temperature are used. The HFSM using a
saturated temperature yields an initial critical break mass flux of 29997 ± 245 kg/m2s, which shows it to under-predict
the BAMS mean mass flux by 0.6 percent. All of these averages and standard deviations are
summarized in Table 4-3.
provides good agreement with the measured data when
one uses a saturated temperature, Tsat, at the given system pressure, Po.
Since the HFSM was developed for saturated and subcooled liquid system conditions, this is
a valid assumption (see Section 2.3). The HFSM over-predicts the BAMS mean mass flux by
19.3 percent when a subcooled pressure and temperature are used. The HFSM using a
saturated temperature yields an initial critical break mass flux of 29997 ± 245 kg/m2s, which shows it to under-predict
the BAMS mean mass flux by 0.6 percent. All of these averages and standard deviations are
summarized in Table 4-3.
Table 4-3. Average values and population standard deviations of selected mass flux data shown in Table 4-1 and Table 4-2.
BAMS |
Equation 4-1 |
HFSM Using To and Po |
HFSM Using Tsat and Po |
|
Mean (kg/m2s) |
30192 |
27482 |
36025 |
29997 |
Population Standard Deviation ( s) |
2390 |
2225 |
997 |
245 |
s is _% of Mean* |
7.9 |
8.1 |
2.8 |
0.8 |
Mean is _% of Mean-BAMS** |
100.0 |
91.0 |
119.3 |
99.4 |
*
This percent corresponds to the ratio of the Population Standard Deviation to the Mean for the specified model or measurement.4.3 Effect of BAMS Measurement Delay
Table 4-1 presents the BAMS’ measured delay times for the series of small break
tests. The delay times vary significantly with each test, and they are shown in Figure 4-7
through Figure 4-15. The reason for the differences in time delay may be the existence of
slight variations in the break separator’s initial liquid level. Because the break
separator diameter is quite large, small differences in liquid level represent large
volumes relative to the volumetric flow rates of small break simulations. That is, for the
very low break flow rates encountered in these tests, the time required to fill the break
separator to its steady-state discharge level would be significantly different if the
initial break separator was not equal to this optimum steady-state discharge level. For
example, an initial break separator liquid level difference of 0.85 cm would explain the
time delay difference between NRC-5005 ![]() and NRC-5105
and NRC-5105 ![]() as listed in Table 4-1. In general, however, the
time delays are insignificant relative to the entire depressurization transient.
as listed in Table 4-1. In general, however, the
time delays are insignificant relative to the entire depressurization transient.
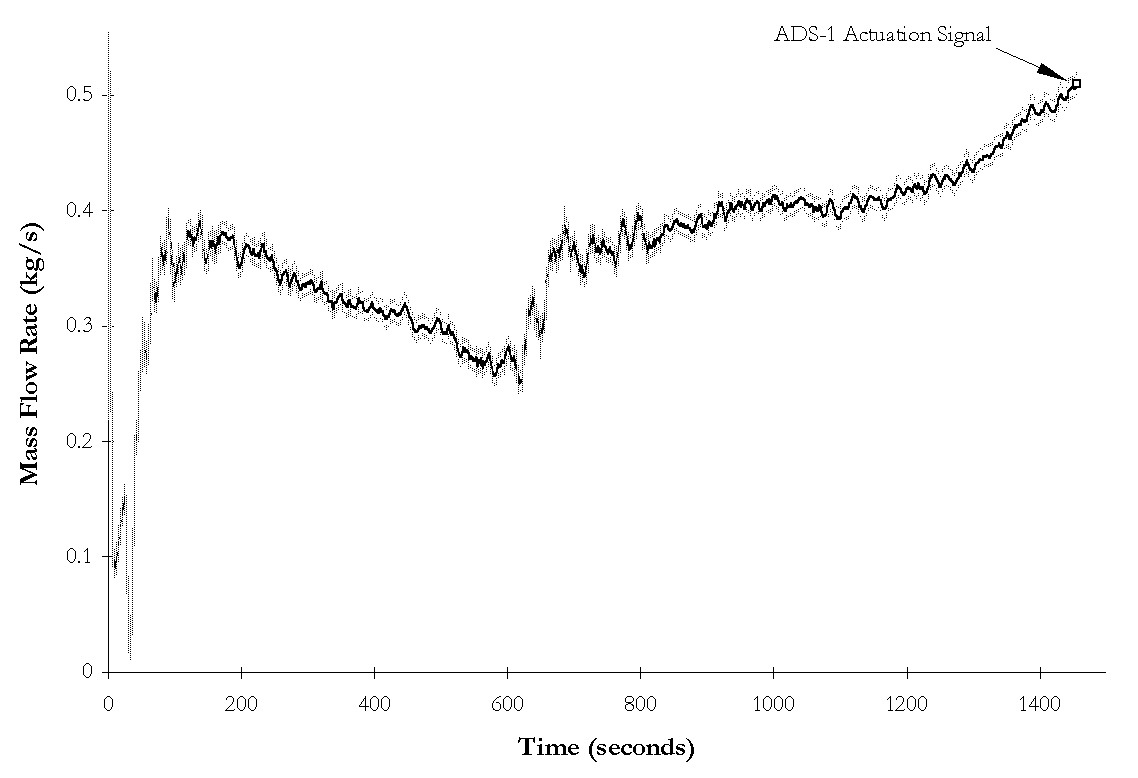
Figure 4-7. NRC-5001 ![]() BAMS measured break flow rate and instrumentation
uncertainties as functions of time during subcooled blowdown.
BAMS measured break flow rate and instrumentation
uncertainties as functions of time during subcooled blowdown.
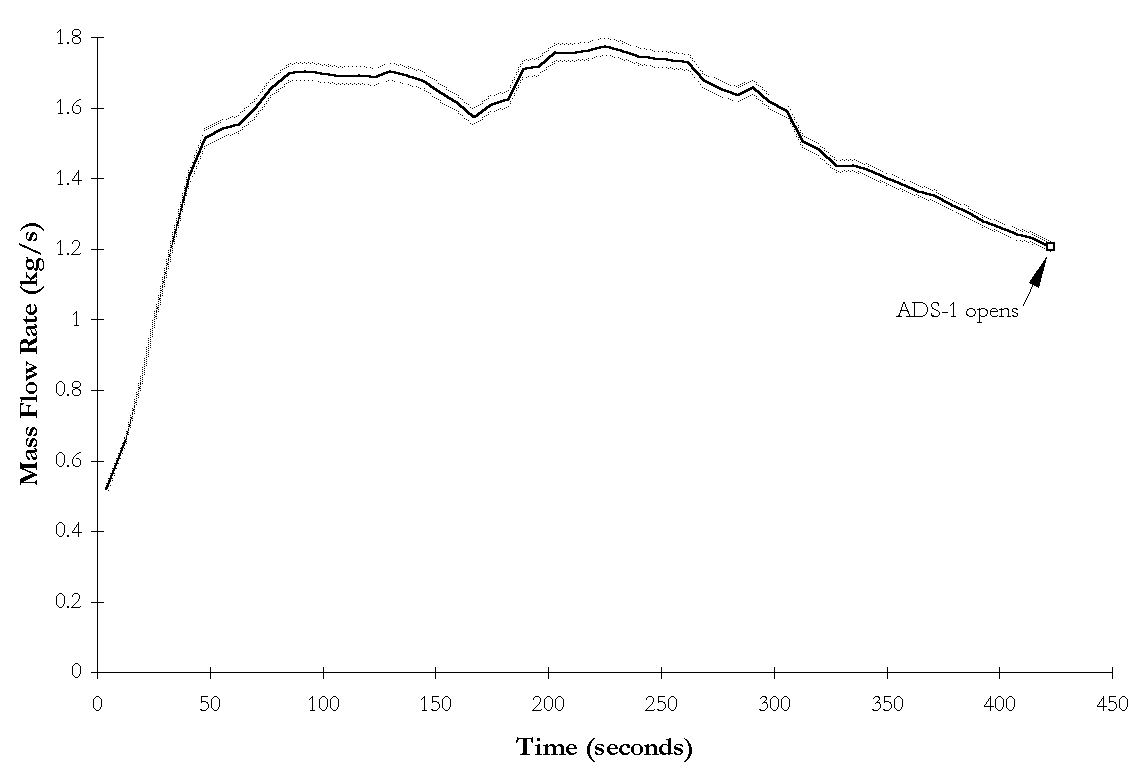
Figure 4-8. NRC-5003 ![]() BAMS measured break flow rate and instrumentation
uncertainties as functions of time during subcooled blowdown.
BAMS measured break flow rate and instrumentation
uncertainties as functions of time during subcooled blowdown.
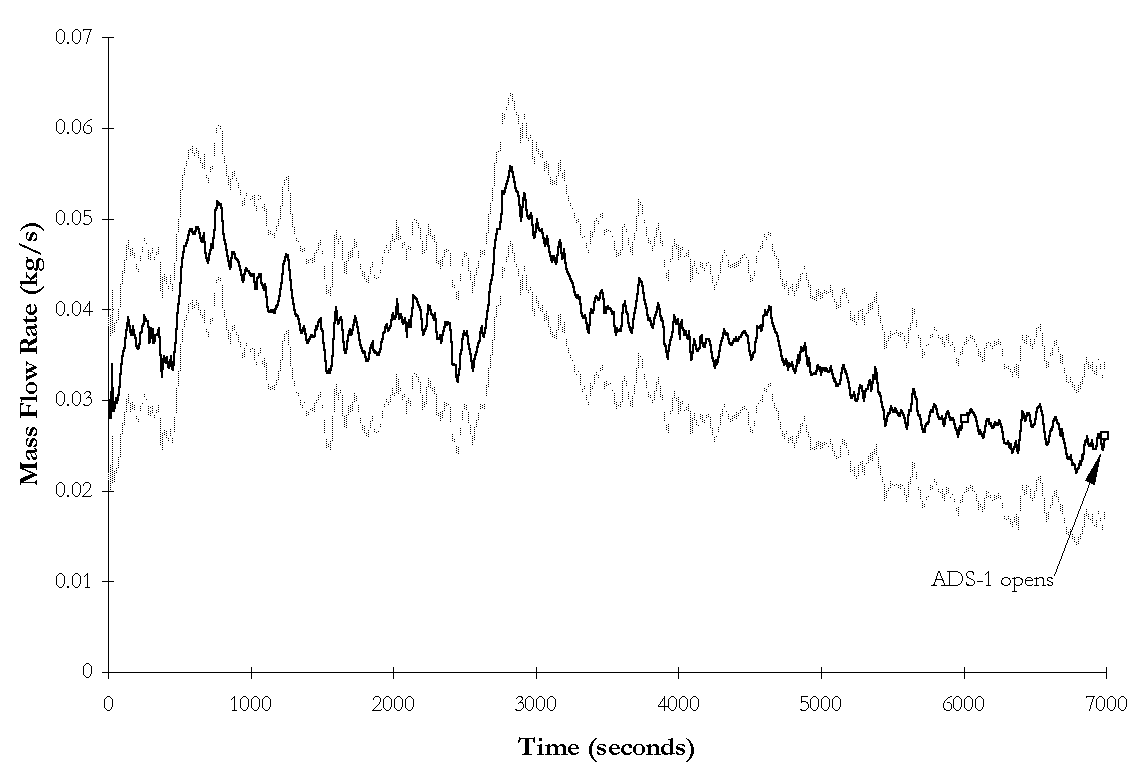
Figure 4-9. NRC-5005 ![]() BAMS measured break flow rate and instrumentation
uncertainties as functions of time during subcooled blowdown.
BAMS measured break flow rate and instrumentation
uncertainties as functions of time during subcooled blowdown.
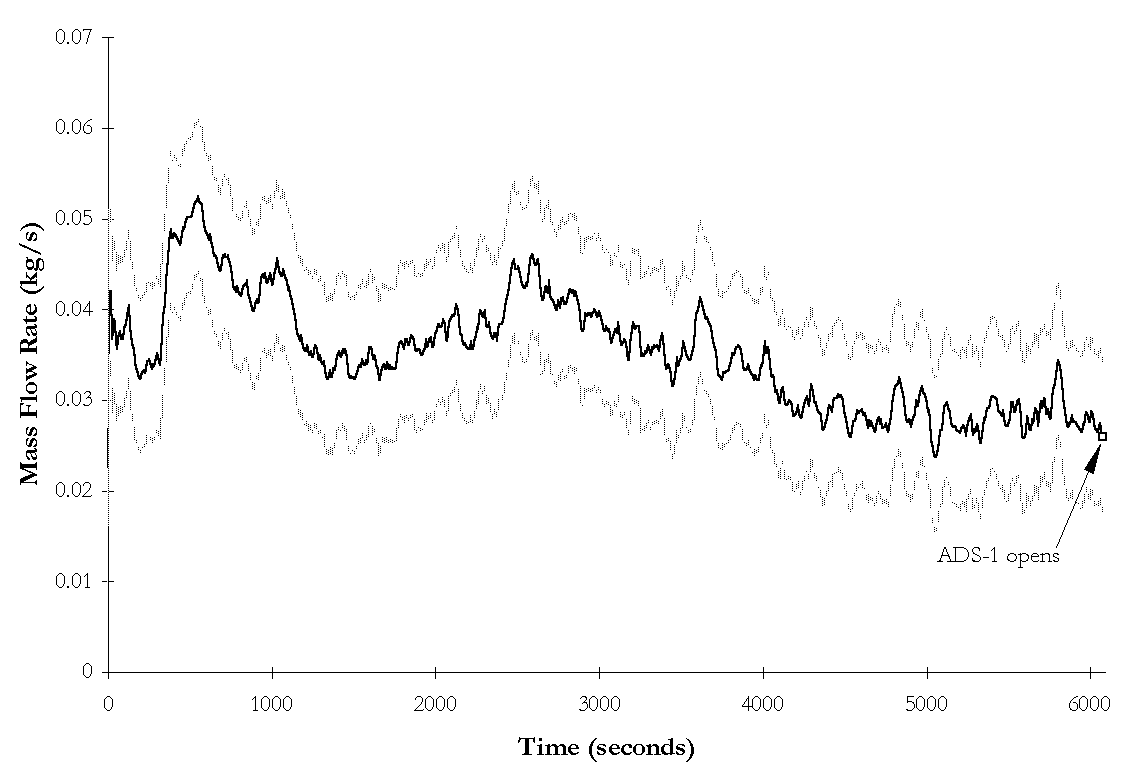
Figure 4-10. NRC-5105 ![]() BAMS measured break flow rate and instrumentation
uncertainties as functions of time during subcooled blowdown.
BAMS measured break flow rate and instrumentation
uncertainties as functions of time during subcooled blowdown.
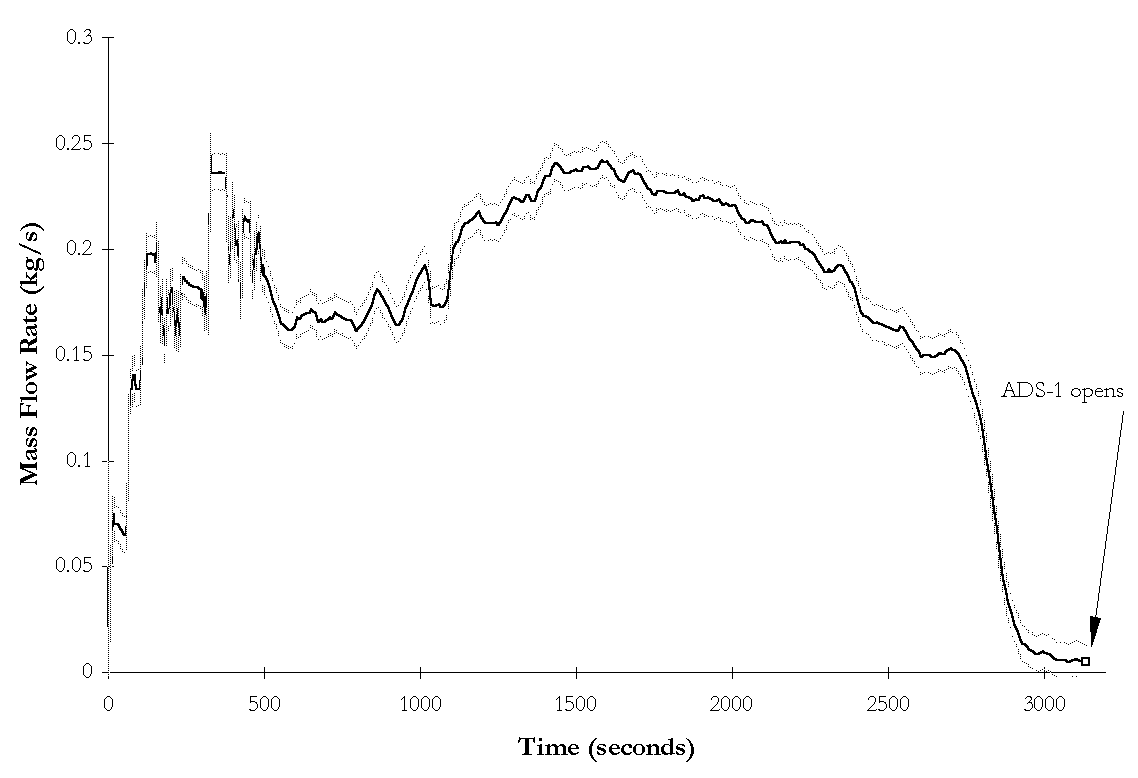
Figure 4-11. NRC-5007 ![]() BAMS measured break flow rate and instrumentation
uncertainties as functions of time during subcooled blowdown.
BAMS measured break flow rate and instrumentation
uncertainties as functions of time during subcooled blowdown.
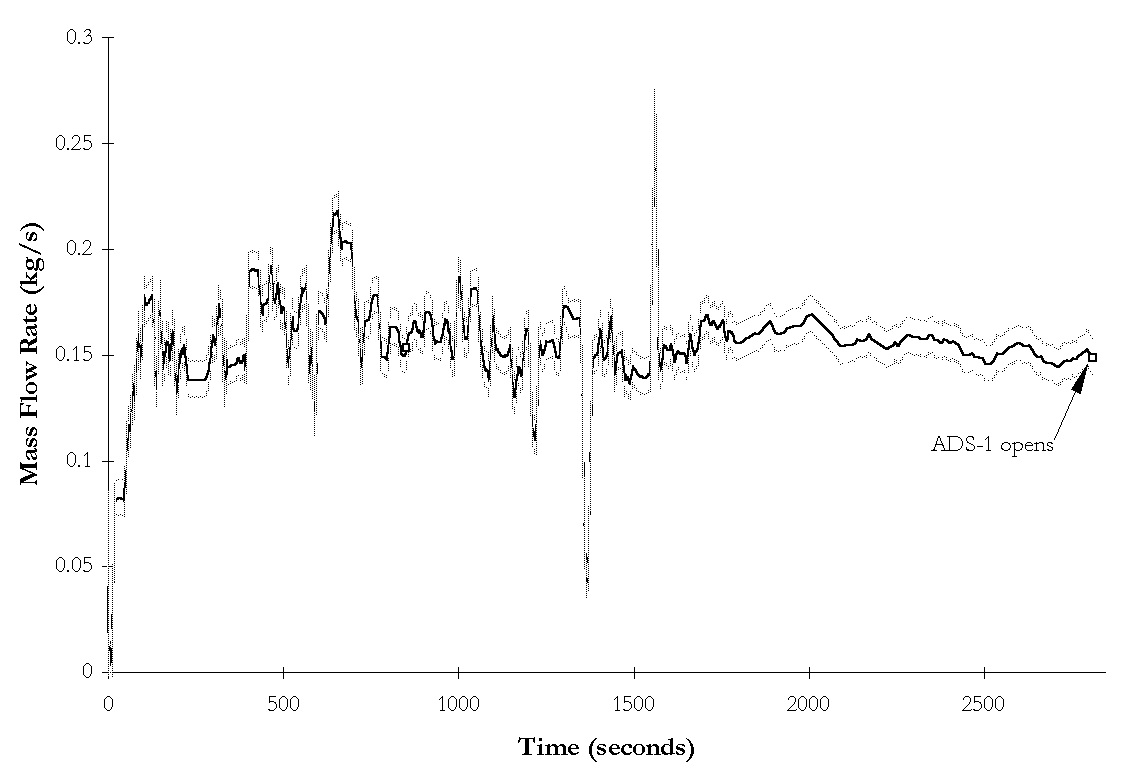
Figure 4-12. NRC-5107 ![]() BAMS measured break flow rate and instrumentation
uncertainties as functions of time during subcooled blowdown.
BAMS measured break flow rate and instrumentation
uncertainties as functions of time during subcooled blowdown.
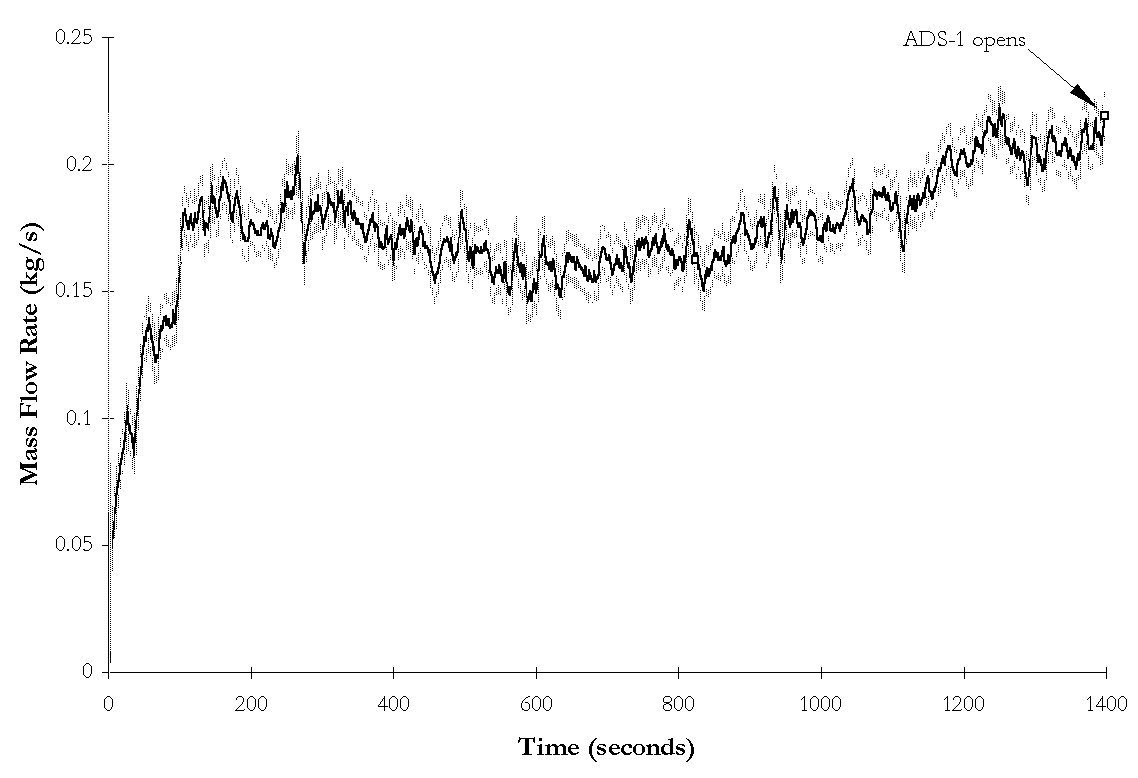
Figure 4-13. NRC-5010 ![]() BAMS measured break flow rate and instrumentation
uncertainties as functions of time during subcooled blowdown.
BAMS measured break flow rate and instrumentation
uncertainties as functions of time during subcooled blowdown.
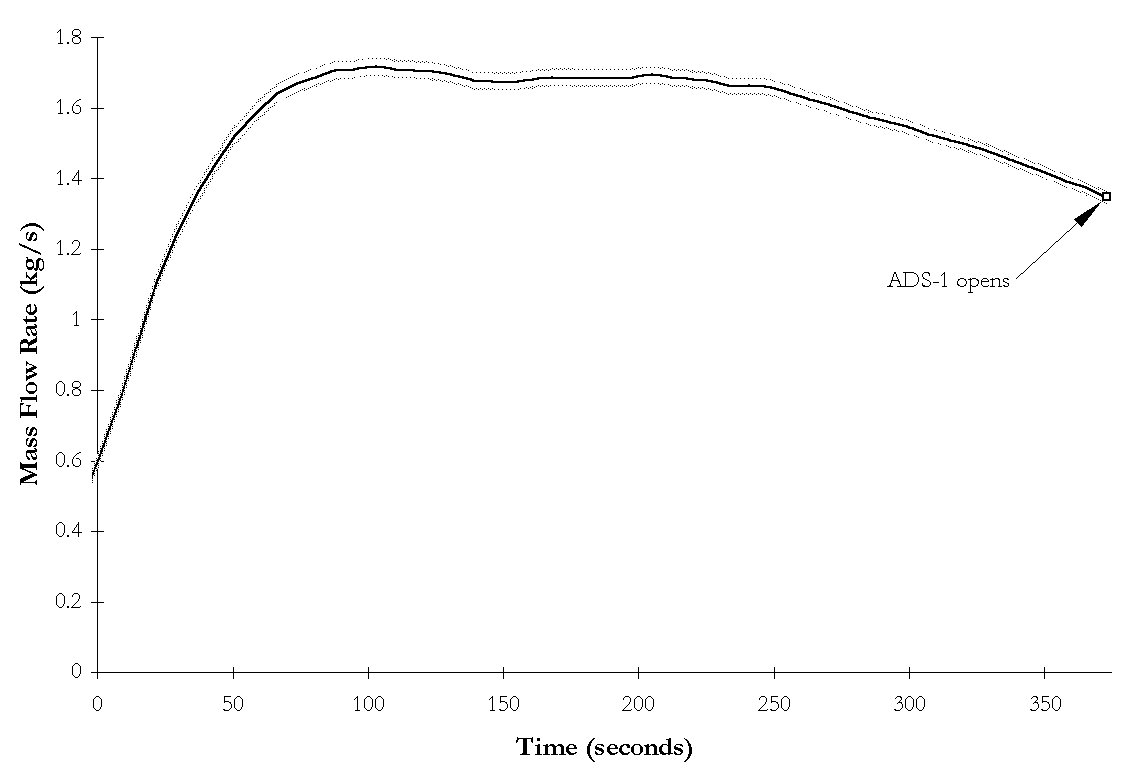
Figure 4-14. NRC-5111 ![]() BAMS measured break flow rate and instrumentation
uncertainties as functions of time during subcooled blowdown.
BAMS measured break flow rate and instrumentation
uncertainties as functions of time during subcooled blowdown.
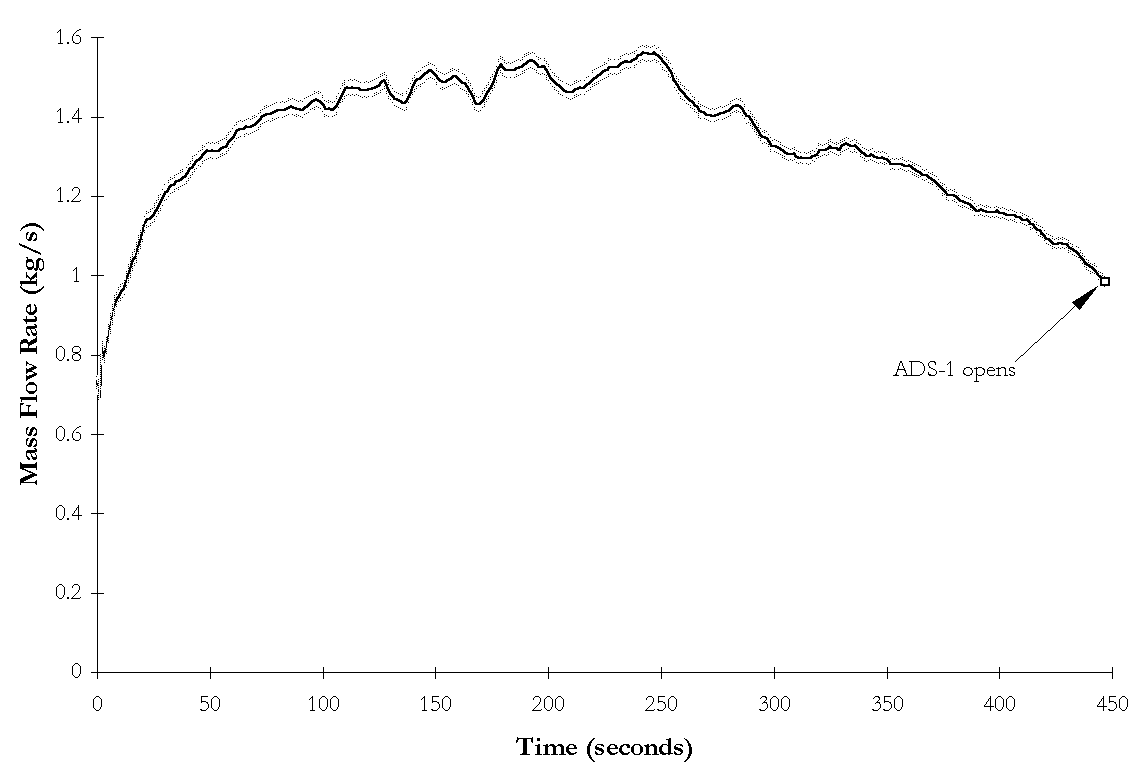
Figure 4-15. NRC-5012 ![]() BAMS measured break flow rate and instrumentation
uncertainties as functions of time during subcooled blowdown.
BAMS measured break flow rate and instrumentation
uncertainties as functions of time during subcooled blowdown.
4.4 Discussion of Instrumentation Accuracy
As seen in the previous sections, there exist some measurement errors for the
instruments used. The Differential Pressure transducer used to measure the
pressurizer liquid level has an error of ±1.08 cm, and it is not shown in the figures
above because it is small compared to the pressurizer’s initial liquid level. The
error in the level measurement is assumed to be a constant value, since it is based upon a
fraction of the transducer’s calibrated range. The Magnetic and Vortex Flow
Meters used to measure the liquid and vapor flow rates through the simulated break
have errors of ±8.03 cm3/s and ±950 cm3/s respectively. The thermocouple
located in the pressurizer’s water-space has an inherent error of ±1.13 ºK. All of
these instrument errors are taken from the OSU APEX Instrument Calibration Database ![]() . When these errors are incorporated into the break
flow rate calculations, they yield minimum and maximum flow rates as shown on the figures
in the previous section.
. When these errors are incorporated into the break
flow rate calculations, they yield minimum and maximum flow rates as shown on the figures
in the previous section.