![]() .
.
(5-1)
5. Integrated Mass Method
Given the above description of the APEX Facility, it is an intuitive assumption that no simple flow model will be adequate to predict the transient break flow behaviors for all possible plant conditions. This assumption leads to the introduction of an integrated method that is not as sensitive to the system’s initial conditions.
Because a critical flow condition existed at the break location from the onset of the transient up to the point of ADS-1 actuation, a constant mass flux is assumed from the onset of the transient,
|
(5-1) |
Also, the discharge coefficient of the break nozzle is assumed to be unity,
|
(5-2) |
Using these two assumptions, the integral relationship for the total mass exiting through the break nozzle,
|
(5-3) |
becomes
|
(5-4) |
Now, define an inverse residence time parameter,
|
(5-5) |
where ![]() is the initial mass flow rate
through the break and
is the initial mass flow rate
through the break and ![]() is the total mass
both above the break location and within the pressurized system. Also, the fraction of
mass remaining within the system as a function of time is defined as
is the total mass
both above the break location and within the pressurized system. Also, the fraction of
mass remaining within the system as a function of time is defined as
|
(5-6) |
It is simple to derive a dimensionless group from Equations 5-4 through 5-7 in terms of time and initial conditions only:
|
(5-7) |
Thus, it can be shown that
|
(5-8) |
The dimensionless groups described in the previous section were used to predict the
total mass exiting the primary system through the break. The analysis was performed for
test times prior the actuation of the ADS for all data, but it should be noted that ADS-1,
ADS-2 and ADS-3 valves were not opened during the test, NRC-5001. The BAMS break flow data
was integrated and used in Equation 5-6 to determine the time-dependent value of ![]() . Then, for the same range of time, t,
the values of
. Then, for the same range of time, t,
the values of ![]() were calculated using
Equation 5-7. Table 5-1 summarizes some important information regarding the results of the
aforementioned data analysis, and the data is shown in Figure 5-1 through Figure 5-7. The
purpose of the linear regressions is to determine how well the integrated mass model
corresponds to the measured data.
were calculated using
Equation 5-7. Table 5-1 summarizes some important information regarding the results of the
aforementioned data analysis, and the data is shown in Figure 5-1 through Figure 5-7. The
purpose of the linear regressions is to determine how well the integrated mass model
corresponds to the measured data.
Table 5-1. Integrated mass analysis linear data regression information.
Test ID |
Slope |
Coefficient
of Determination, |
NRC-5001 |
0.9828 |
0.9844 |
NRC-5003 |
1.0021 |
0.9968 |
NRC-5105 |
0.9958 |
0.9936 |
NRC-5107 |
1.0162 |
0.9904 |
NRC-5010 |
1.0053 |
0.9977 |
NRC-5111 |
1.0077 |
0.9912 |
NRC-5012 |
0.9851 |
0.9952 |
As can be seen in Table 5-1, the simple integrated mass model yields good predictions of mass losses through the break nozzle to the time of ADS-1 actuation. System conditions change significantly beyond ADS-1 actuation, thus the model would not be valid.
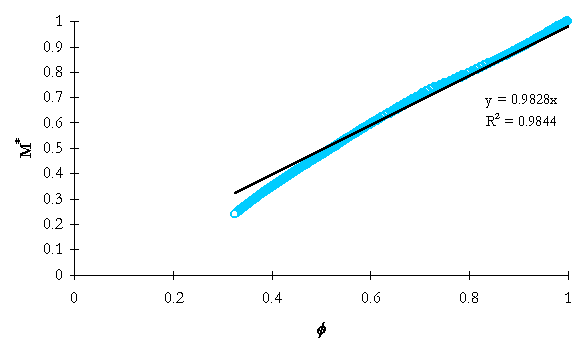
Figure 5-1. NRC-5001 integrated system mass ratio versus integrated flow model dimensionless group.
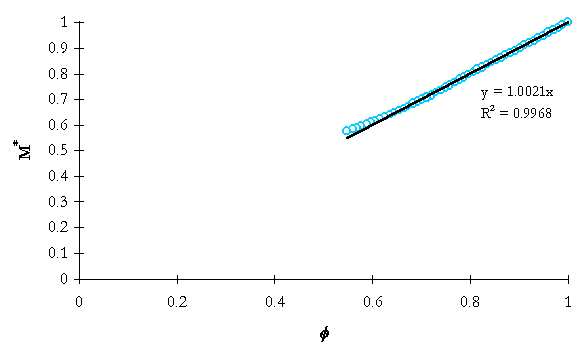
Figure 5-2. NRC-5003 integrated system mass ratio versus integrated flow model dimensionless group.
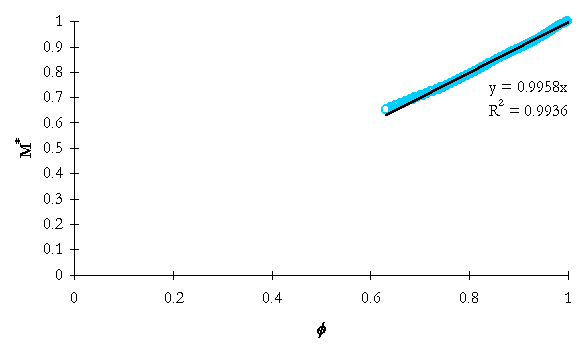
Figure 5-3. NRC-5105 integrated system mass ratio versus integrated flow model dimensionless group.
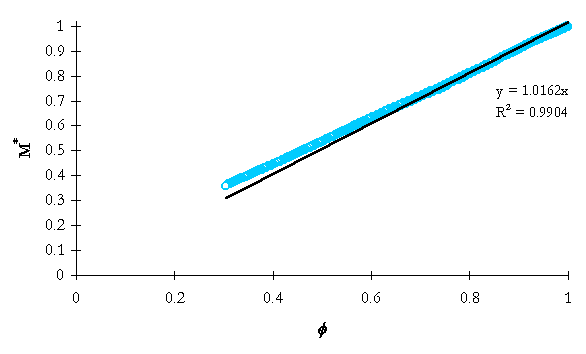
Figure 5-4. NRC-5107 integrated system mass ratio versus integrated flow model dimensionless group.
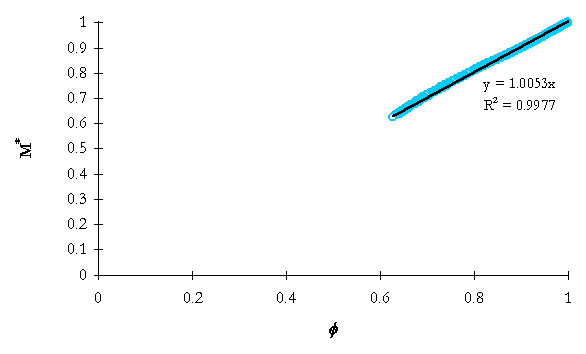
Figure 5-5. NRC-5010 integrated system mass ratio versus integrated flow model dimensionless group.
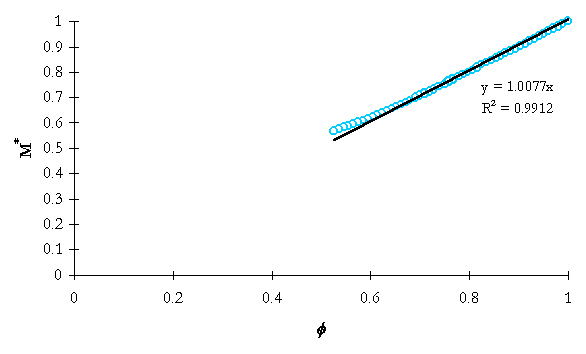
Figure 5-6. NRC-5111 integrated system mass ratio versus integrated flow model dimensionless group.
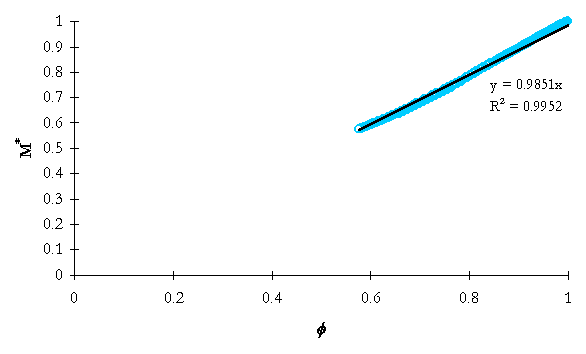
Figure 5-7. NRC-5012 integrated system mass ratio versus integrated flow model dimensionless group.
All of the test data was normalized to the ADS-1 actuation time using the following relations:
|
(5-9) |
and
|
(5-10) |
Using the normalizations, the data can be condensed to a single plot, and the result is shown in Figure 5-8. This result is quite astounding in that it demonstrates that a very simple flow model is capable of accurately predicting the break flow behavior of the APEX test facility to the time of ADS-1 actuation.
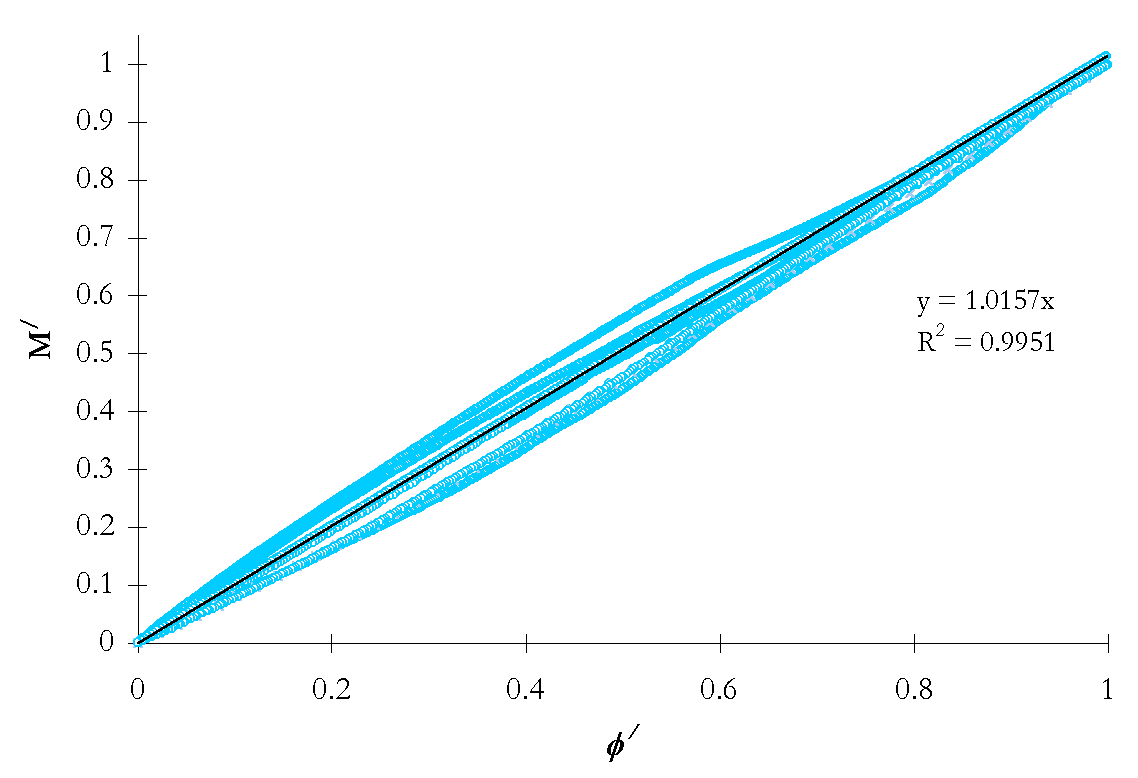
Figure 5-8. Normalized integrated system mass ratio versus normalized saturated flow model dimensionless group for all test data shown in Figure 5-1 through Figure 5-7.